
What Un-inversion Means — A Quick Summary
The US Treasury yield curve typically slopes upward, reflecting higher yields for longer maturities. It inverts when short-term yields (like the 2-year) rise above long-term yields (like the 10-year), usually because the Federal Reserve is aggressively tightening policy.
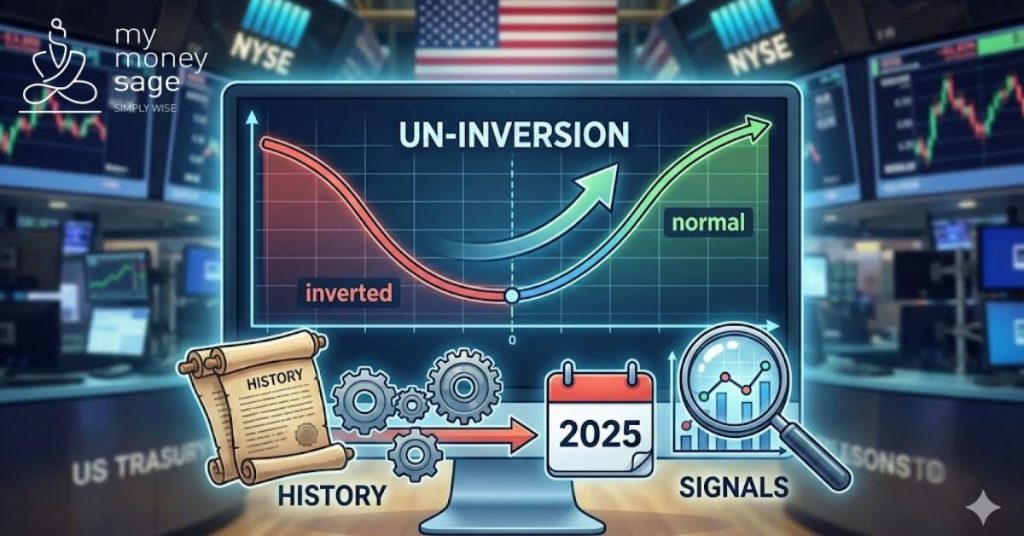
Un-inversion happens when this inversion disappears and the curve returns to positive territory. While inversion gets the headlines, history shows that un-inversion is the real recession signal. It marks the phase when markets stop worrying about inflation and start pricing in economic weakness, Fed rate cuts, and falling short-term yields.
As of December 2025, the US curve has been un-inverted for about 12 months, after decisively turning positive in December 2024.
What History Tells Us — The Recession Clock Begins at Un-inversion
Since 1970, whenever the 10Y–2Y curve has been inverted for over 90 days, a recession has followed 3 to 13 months after un-inversion. The inversion itself is the warning; the un-inversion starts the countdown.
Key historical episodes:
- 1989 cycle: Recession began 13 months after un-inversion. Markets rallied for almost a year before the downturn.
- 2000 cycle: Recession followed 3 months after un-inversion, coinciding with the Dot-Com bust.
- 2006–07 cycle: Recession began 6 months after un-inversion. Equities hit all-time highs just four months earlier.
- 2022–24: The longest inversion ever (780 days). Un-inversion occurred in Dec 2024, making late mid-2026 the high-risk window.
Historically, investors tend to believe in the “soft landing” narrative immediately after un-inversion — and those phases have often preceded major drawdowns.
The Current Situation — The “False Peace” of 2025
A Record Inversion Followed by a Flat Un-inversion
The curve normalized in December 2024, marking the official start of the recession clock. Over the following 12 months of 2025, the curve has stayed barely positive—hovering around +10 to +20 bps.
This is unusual. Past cycles saw sharper steepening; this slow, almost stagnant un-inversion has created a sense of calm before the storm.
A Shift from Bear Steepener to Bull Steepener
- 2023–24: Steepening happened because long-term yields rose faster — signalling inflation persistence.
- Late 2025: The dynamic has shifted. Short-term yields are falling as the Fed cuts rates, while long-term yields remain stickier.
This “bull steepener” is the classic pre-recession setup usually.
Weakening US Macro and Rate-cut Cycle
- Fed rate cuts began in October 2024 and have continued into 2025.
- Cuts are no longer seen as pre-emptive support — they increasingly look like a response to softening macro indicators.
- Consumption, labour sentiment, and liquidity conditions are showing early signs of strain, even if headline GDP still appears firm.
AI Bubble Signs — Echoes of 2000?
The current market structure draws comparisons to the Dot-Com era:
- In 2000, the curve un-inverted in December; the bubble burst in March 2001.
- In 2025, AI stocks remain up substantially year-to-date (+5% to +68% for Magnificent Seven), but November weakness and stalled momentum despite strong earnings suggest that valuations have fully priced in AI benefits and markets are now demanding proof of sustained returns. This is more an earnings verification phase than a liquidity crisis. The discount-rate sensitivity remains real (as evidenced by strong late-November rally on rate cut hopes), but the critical driver is now whether companies can deliver on the ambitious growth assumptions embedded in current prices, not whether liquidity is available at current prices.
The Three Preconditions Framework (Status as of late 2025)
- Yield Curve Un-inversion: Partially satisfied; decisive steepening expected around late 2025–early 2026.
- Reverse Repo Balances: Declining but still elevated — signalling early-stage liquidity absorption.
- Fed Rate Cuts: Underway; confirmation of weakening momentum.
The alignment of all three has historically preceded recessions. Today, two are partially met, one is ongoing — placing the economy somewhere around the middle of the risk spectrum.
What the Present Signals — Observations
Putting the historical data and current context together, a few inferences emerge:
- The US is in Month 12 of the typical 3–13 month lag. This timeframe has historically been the “danger zone,” especially in cycles like 1989–1990.
- The curve’s slow and shallow un-inversion has encouraged complacency, similar to mid-2007.
- The Fed’s ongoing rate-cut cycle reflects underlying economic stress, even if headline numbers still look stable.
- AI-heavy segments could be the first to react if liquidity tightens further, similar to 2000’s pattern where high-valuation sectors cracked before the broader economy.
- A final melt-up in early 2026 cannot be ruled out. Historically, markets often rally strongly between un-inversion and recession onset (e.g., 2007’s 48% Nifty rally in the analogous phase).
None of these imply certainty — only that historical patterns and current macro conditions are aligned in a way that usually precedes an economic slowdown.
Final View
Taken together, the present environment resembles earlier late-cycle phases where the yield curve’s un-inversion marked a period of “false peace” before momentum cooled. Historically, episodes like 2000 and 2007 saw similar patterns — markets rallied, narratives of resilience grew louder, and only later did stress surface after the un-inversion had quietly started the countdown. While outcomes are never assured, the mix of weakening US macro indicators, ongoing rate cuts, and growing nervousness around speculative pockets within the AI theme has created a more cautious undertone. These factors suggest the US economy may be moving into the mature stage of the post-inversion lag that has, in earlier cycles, been associated with rising recession risk.
Disclaimer:
This article should not be construed as investment advice, please consult your Investment Adviser before making any sound investment decision.
If you do not have one visit mymoneysage.in