
Last two years of Indian equity markets is characterized by heavy foreign investor selling, elevated crude oil prices, a weaker rupee, higher global bond yields and the rotation of international capital towards AI linked technology and semiconductor businesses.
Our central message is therefore measured: we do not believe a long term equity allocation should be abandoned because of weak recent returns. We are reviewing portfolios, rebalancing where needed and investing fresh money in stages.
What is happening in Indian equities?
- Foreign investor selling: sustained outflows have created a large source of supply, while a stronger US dollar and higher US yields have made emerging market exposure less attractive.
- The AI led global rally: capital has favoured US technology , Taiwanese and South Korean semiconductor and hardware businesses. India has fewer direct beneficiaries of this investment cycle, although some domestic infrastructure suppliers may benefit.
- Oil and the rupee: India imports a large share of its energy needs. A sustained rise in crude can pressure inflation, the current account, corporate margins and the currency.
- Valuations and earnings expectations: India entered this period at a high relative valuation. Even where company profits continue to grow, share prices can fall if earnings disappoint or investors are no longer willing to pay the earlier valuation multiple.
- Interest rates: on 7 October 2026 the RBI raised the repo rate by 25 basis points to 5.50%, while raising its FY27 growth projection to 7.1% and its inflation projection to 5.2%. This reflects a more difficult inflation backdrop, not simply a weaker growth outlook.
Why we still hold Indian equities: earnings and the economy
% holding by FIIs & DIIs:
| Mar-23 | Mar-24 | Mar-25 | Sep-25 | Dec-25 | Mar-26 | Jun-26 | |
| Foreign investors (FPIs) | 19.10% | 17.90% | 17.50% | 16.90% | 16.70% | 15.80% | 15.10% |
| Domestic institutions (DIIs) | 17.10% | 16.50% | 18.20% | 18.70% | 19.00% | 19.60% | 19.50% |
| Gap (DIIs minus FPIs) | −2.0 | −1.4 | 0.7 | 1.8 | 2.3 | 3.8 | 4.4 |
Domestic institutions now own more of Indian companies than foreign investors, and the gap has widened every quarter since March 2025. Record SIP flows (₹32,490 crore in September 2026) are absorbing foreign selling. With foreign holdings near a 17 year low, there is less left to sell. When foreign money returns, it will add to steady domestic buying.
Corporate results
Profits have grown in every quarter since the market peaked, at double digits in six of the last seven. Prices have fallen while earnings rose, so the market is cheaper than at its peak.
The slowdown in Apr to Jun 2026 came from one sector: oil marketing companies hit by the oil price shock. Excluding energy, net profit grew 22.6% and operating profit grew at its fastest pace in 11 quarters.
The economy: mostly positive, with inflation being the exception
| Indicator | Latest reading |
| Real GDP growth | 7.8% in Q1 FY27 (April to June 2026), up from 6.9% a year earlier |
| Investment (gross fixed capital formation) | +11.9% in Q1 FY27, double the 5.8% a year earlier |
| Manufacturing and services output | Manufacturing +9.2%, services +10.0% in Q1 FY27 |
| RBI growth forecast for FY27 | Raised to 7.1% from 6.7% on 7 October 2026 |
| GST collections | ₹2.04 lakh crore in September 2026, up 14.7% year on year |
| Purchasing managers’ indices | Manufacturing 55.1 (a seven month high), services 55.2 in September 2026; above 50 signals expansion |
| Bank credit growth | 19.1% year on year in July 2026, nearly double a year earlier |
| Foreign exchange reserves | US$734.6 billion (week to 2 October 2026), US$34.6 billion higher than a year earlier |
| CPI inflation | 5.54% in September 2026, up from 4.83% in August; food inflation 7.74% |
| Policy rate | Repo rate raised 25 basis points to 5.50% on 7 October 2026 |
Sources: Ministry of Statistics (GDP, CPI), RBI (policy, credit, reserves), Ministry of Finance (GST), HSBC and S&P Global (PMI).
The clear negative is inflation. At 5.54% it is above the RBI’s 4% target, driven mainly by food and by fuel costs linked to crude oil, and it prompted the first rate increase since 2023. The RBI described the increase as calibrated and raised its growth forecast at the same time, which signals that it sees an inflation problem rather than an economy that is weakening.
Why this supports staying invested in India
- The fall has been in prices, not in profits. Company earnings have grown through the correction, so the market is cheaper because of earnings growth as much as falling prices.
- India’s growth is domestically driven. Investment, manufacturing, credit and tax collections are all growing at double digit rates. This growth does not depend on the global AI cycle that has drawn foreign money elsewhere.
- Business momentum is improving, not fading. Revenue growth has accelerated for three straight quarters, from 6.6% to 18.9% for the Nifty 500, and profits have kept growing throughout the correction. Past recoveries have started from exactly this kind of base.
- Domestic savings keep flowing in. Record SIP contributions give the market a steady buyer while foreign investors are selling.
Historical returns: strong long term outcomes, uneven yearly results
A calendar year return can hide how difficult the journey was. Investors can experience a sharp fall, a long period without a new high and then a rapid recovery. The reverse is also true: a strong previous year does not guarantee another strong year. The table below uses calendar year total return figures for 2011 to 2025. The 2024 Nifty 500 figure is approximate; 2026 figures are price returns to mid October and are not directly comparable with full year total returns.
| Year | Nifty 50 TRI | Nifty 500 TRI | Context |
| 2011 | −23.8% | −26.4% | Inflation, rate hikes and eurozone stress |
| 2012 | +29.4% | +33.5% | Rebound after the previous year’s fall |
| 2013 | +8.1% | +4.8% | Rupee pressure and US taper concerns |
| 2014 | +32.9% | +39.3% | Election rally and improving sentiment |
| 2015 | −3.0% | +0.2% | Global sell off and China concerns |
| 2016 | +4.4% | +5.1% | Low index returns despite volatility |
| 2017 | +30.3% | +37.7% | Broad rally and domestic flows |
| 2018 | +4.6% | −2.1% | NBFC stress and mid and small cap weakness |
| 2019 | +13.5% | +9.0% | Large cap led, relatively narrow gains |
| 2020 | +16.1% | +17.9% | Covid sell off followed by a sharp recovery |
| 2021 | +25.6% | +31.6% | Post pandemic rally |
| 2022 | +5.7% | +4.2% | Global rate hikes and the Russia Ukraine war |
| 2023 | +21.3% | +26.9% | Broad based recovery |
| 2024 | +10.1% | +16% | Market peaked in September before correcting |
| 2025 | +11.9% | +7.8% | Large caps recovered more than smaller stocks |
| 2026 to mid Oct | about −12% (price) | about −7.5% (price); still below its Sep 2024 high | Weakness from outflows, oil and rate concerns |
| 2011 to 2025, a year | +11.5% | +12.3% | Compound annual growth rate |
The above table illustrates the point: even during a period that produced healthy long term compounding, investors had to navigate negative years, low return years and sharp swings. The return figures are index returns, not the experience of every portfolio. A client’s actual outcome will depend on entry date, fund or stock selection, fees, taxes and asset allocation.
What long term rolling returns tell us
| Holding period | Average annualised return | Worst annualised return | Share of periods with negative returns |
| 1 year | 15.5% | −51.7% | 25.6% |
| 3 years | 15.0% | −12.6% | 6.5% |
| 5 years | 15.3% | +0.2% | 0% |
| 10 years | 14.0% | +6.4% | 0% |
Nifty 50 total return index, monthly rolling windows, June 1999 to 14 October 2026. -15 years
One in four one year periods lost money, but no five or ten year period did. The weakest ten year period still returned 6.4% a year. Staying invested has historically mattered more than timing.
S&P 500: a strong run, but not a one way market
US equities have beaten Indian equities in recent years. To 30 September 2026, the S&P 500 returned 13.8% a year over five years and 15.3% a year over ten years, in US dollars. The Nifty 500 returned about 9% and 13% to 14% over the same periods. For rupee investors the gap is wider, because the rupee weakened. The S&P 500 is up about 14% this year and is at record highs.
The US market has also had long spells of flat or negative returns:
| Period | What US investors experienced |
| 2000 to 2002 | Three straight years of losses (−10%, −13%, −23%). |
| 2000 to 2009 | A full decade with negative returns, about −1% a year including dividends. |
| Mar 2000 to Mar 2013 | Two falls of about 49% and 57%. The index was back near its 2000 level after 13 years. |
| Jan 2022 to Jan 2024 | A 25% fall and two years to regain the peak. |
An investor who bought the S&P 500 at its 2000 high earned close to nothing for over a decade. Over the same decade, Indian equities delivered strong gains. Leadership between markets shifts, and the market that has led for years is not guaranteed to keep leading.
The current US rally is also narrow. More than 4 in 10 S&P 500 stocks are lower this year, and the median stock has gained barely 4%. Technology accounts for over 10 percentage points of the index’s 14% rise. The Federal Reserve raised rates in September and more increases are expected. Higher oil prices and bond yields are weighing on companies outside AI. When a market’s gains depend on a handful of stocks and one theme, the risk of a setback rises if that theme disappoints.
How dependent the US rally is on AI
Most of the S&P 500’s gains rest on a small group of AI linked companies. Technology accounts for over 10 percentage points of the index’s 14% rise this year. J.P. Morgan estimates that 41 AI linked stocks now make up about 49% of the S&P 500’s value, the second highest concentration in one theme in the index’s history. Earnings are just as concentrated. S&P 500 earnings are expected to grow 29% this quarter, but excluding Micron and Nvidia alone, growth falls to 20%.
US households have never held more of their savings in shares. Past peaks were followed by S&P 500 falls of 25% to 57%. This does not tell us when a fall will come, but there is less new money left to push prices higher. In our view, this raises the risk in US equities.
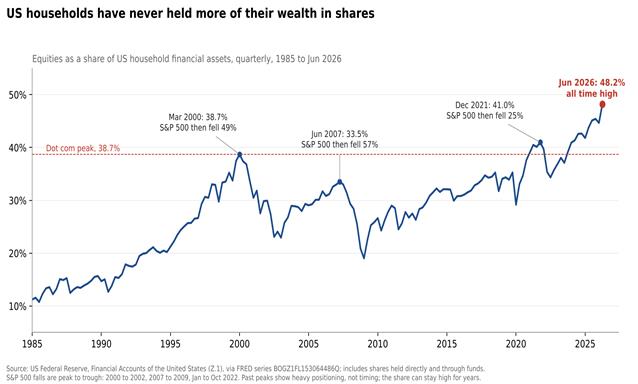
The figures come straight from the Federal Reserve’s quarterly data. The S&P 500 falls are the standard peak to trough declines for 2000 to 2002, 2007 to 2009 and January to October 2022.
What is driving current concern around AI?
- Spending is running far ahead of revenue: Gartner estimates AI providers will invest close to $1 trillion in infrastructure in 2026 and a further $6 trillion between 2027 and 2030. Investors are now questioning whether revenue will justify it. Worries that OpenAI’s revenue will fall short sent the Nasdaq 100 down 1.4% on 8 October, its worst day in seven weeks.
- The boom is increasingly funded by debt: large technology companies took on about $194 billion of net new debt over the past year while cutting share buybacks by half. More leveraged players are under strain: on 14 October CoreWeave fell 15.5% as yields on its data centre bonds approached 15%, and the Nasdaq Composite fell 1.9%.
- Circular financing: AI companies are increasingly funding their own customers. Nvidia agreed in 2025 to invest up to $100 billion in OpenAI, which in turn buys Nvidia chips. OpenAI signed a $300 billion cloud contract with Oracle, which uses the money to buy more Nvidia chips. In July 2026, Nvidia was reported to be weighing a guarantee for $250 billion of financing for an OpenAI data centre, and its shares fell 4.5% that day. The IMF’s October 2026 Global Financial Stability Report found that 14 such deals since 2023, worth about $300 billion of equity and $650 billion of debt, have generated about $1.4 trillion in promised future revenue. If AI revenue disappoints, the same companies would be hit three ways at once: equity losses, debt they struggle to repay, and orders that are never paid for.
- Debt kept off the balance sheet: a growing share of data centre spending is funded through separate companies, known as special purpose vehicles, so the debt does not appear on the technology company’s own books. The largest example is Meta’s Hyperion data centre in Louisiana. A vehicle 80% owned by Blue Owl raised $27.3 billion of bonds, while Meta holds 20%, leases the site in four year blocks and guarantees its value. The Bank for International Settlements has called this “shadow borrowing” and warned that it ties AI risk to private credit funds, insurers and banks that lend to these vehicles.
- Valuations and concentration are stretched: seven companies make up roughly a third of the S&P 500. The S&P 500 Shiller CAPE reached about 40 in June 2026, more than double its long run average of about 17. Readings this high have historically been followed by weak returns over the following decade.
- Rates may not help: US inflation rose to 3.7% in September, reviving the prospect of further Federal Reserve rate increases. Those hit highly valued growth stocks hardest.
We are not predicting a massive crash in very short term, the leading technology companies remain highly profitable currently. But the balance of risk has shifted. The AI trade is now crowded, expensive and increasingly dependent on borrowed money, and the market has started to question whether the returns will match the spending. After three years in which almost everything went right for US technology, the coming years are more likely to bring lower and more volatile returns. That matters for India, because the AI trade is the main reason global money has left.
Why this matters for India
India fell behind largely because it had little to offer the AI trade. That same feature could now work in its favour. In September 2026, J.P. Morgan described India as the largest and most liquid market for investors who want to reduce their exposure to crowded AI trades. Estimates are that a return to neutral positioning could bring around $115 billion into India. Foreign investors bought about $5.5 billion in July and August 2026, an early sign of interest, before selling resumed.
This shift is not automatic. Money leaving AI may go to bonds, cash or other markets, and it is unlikely to come to India in size while oil stays above $100 and US yields stay high. Whether those conditions ease, and how quickly, will shape the next 12 to 24 months.
Our Outlook: what the next 12 to 24 months could bring
History tells us how markets have behaved, but it does not tell us what happens next. The honest answer is that the near term could stay difficult. Crude oil is above $100, inflation has risen to 5.54%, the RBI has started raising rates and foreign investors are still selling. We do not expect these pressures to clear quickly. Our allocation is therefore built to withstand a longer difficult period, not to depend on a quick recovery.
Three scenarios for the next 12 months
| Bear case | Base case | Bull case | |
| What the market assumes | Oil stays high, US rates rise and foreign investors keep selling | Earnings grow 10% to 15% a year; oil and inflation ease slowly | Oil falls below $80 and earnings grow about 19% a year |
| Expected Nifty move | About 7% down | 8% to 14% up | About 34% up |
| By when | Next 12 months | December 2026 to June 2027 | ~12-16 Months |
What staying invested means in practice:
Staying invested does not mean being fully in equities. It means holding the equity share agreed in each investor’s risk profile, say 60%, through difficult periods. When markets fall, many investors want to cut this to 20%. History shows why that is costly.
| Market fall | Nifty 50 fall | Stayed at 60% equity | Cut to 20% at the low |
| 2015 to 2016 | −22% | Gain of ₹6.0 lakh | Loss of ₹2.7 lakh |
| 2018 | −14% | Gain of ₹2.2 lakh | Loss of ₹2.9 lakh |
| 2020 (Covid) | −38% | Gain of ₹7.8 lakh | Loss of ₹10.1 lakh |
| 2021 to 2022 | −16% | Gain of ₹3.9 lakh | Loss of ₹2.3 lakh |
| 2024 to 2025 | −15% | Gain of ₹3.7 lakh | Loss of ₹1.4 lakh |
₹1 crore invested at the market peak in 60% equity and 40% fixed income, measured when the Nifty 50 regained that peak. Nifty 50 total return index; fixed income at 7% a year.
Every time, the investor who held the allocation came out ahead, because the biggest gains came straight after the lows. This is the discipline behind the steps we describe below.
What this means for investors now
- We do not believe recent underperformance, by itself, is a reason to abandon a long term equity allocation. Equally, we are not suggesting that markets must recover immediately. Foreign flows, crude oil, the rupee, interest rates and quarterly earnings can keep volatility elevated.
- Investors should remain aligned with their agreed asset allocation and financial goals. Where equity exposure is below the intended long term level and the investor has an adequate horizon and risk capacity, the correction may offer an opportunity to rebuild exposure in stages.
- We will continue to review the portfolio as valuations, earnings and market conditions evolve, and we may adjust allocations again if the balance of risk and reward changes. Our approach is not to stay invested regardless of circumstances, but to avoid abandoning sound long term investments solely because returns have been weak over a difficult period.
Investors are advised to consult their financial advisors before making any investment decisions. This view does not constitute investment advice.
If you do not have one visit mymoneysage.in
